Monitor rule status with Prometheus
Prometheus is an open source system monitoring and alerting toolkit hosted at CNCF, and has been adopted by many companies and organizations as a monitoring and alerting tool.
eKuiper's rules are continuously running streaming task. Rules are used to process unbounded streams of data, and under normal circumstances, rules are started and run continuously, producing operational status data. Until the rule is stopped manually or after an unrecoverable error. eKuiper provides a status API to get the running metrics of the rules. At the same time, eKuiper integrates with Prometheus, making it easy to monitor various status metrics through the latter. This tutorial is intended for users who are already familiar with eKuiper and will introduce rule status metrics and how to monitor specific indicators via Prometheus.
Prometheus Metrics
eKuiper exposes the following metrics to prometheus to reflect the current cluster status:
kuiper_rule_status: The status showed status of each rule in eKuiper. 1 represents running, 0 represents paused, and -1 represents abnormal exit.
kuiper_rule_count: How many rules are running and how many rules are suspended in eKuiper.
Rule Status Metrics
Once a rule has been created and run successfully using eKuiper, the user can view the rule's operational status metrics via the CLI, REST API or the management console. For example, for an existing rule1, you can get the rule run metrics in JSON format via curl -X GET "http://127.0.0.1:9081/rules/rule1/status".
{
  "status": "running",
  "lastStartTimestamp": "1712126817659",
  "lastStopTimestamp": "0",
  "nextStopTimestamp": "0",
  "source_demo_0_records_in_total": 265,
  "source_demo_0_records_out_total": 265,
  "source_demo_0_process_latency_us": 0,
  "source_demo_0_buffer_length": 0,
  "source_demo_0_last_invocation": "2022-08-22T17:19:10.979128",
  "source_demo_0_exceptions_total": 0,
  "source_demo_0_last_exception": "",
  "source_demo_0_last_exception_time": 0,
  "op_2_project_0_records_in_total": 265,
  "op_2_project_0_records_out_total": 265,
  "op_2_project_0_process_latency_us": 0,
  "op_2_project_0_buffer_length": 0,
  "op_2_project_0_last_invocation": "2022-08-22T17:19:10.979128",
  "op_2_project_0_exceptions_total": 0,
  "op_2_project_0_last_exception": "",
  "op_2_project_0_last_exception_time": 0,
  "sink_mqtt_0_0_records_in_total": 265,
  "sink_mqtt_0_0_records_out_total": 265,
  "sink_mqtt_0_0_process_latency_us": 0,
  "sink_mqtt_0_0_buffer_length": 0,
  "sink_mqtt_0_0_last_invocation": "2022-08-22T17:19:10.979128",
  "sink_mqtt_0_0_exceptions_total": 0,
  "sink_mqtt_0_0_last_exception": "",
  "sink_mqtt_0_0_last_exception_time": 0
}
The rule status consists of two main parts, one is the status, which is used to indicate whether the rule is running properly or not, its value may be running, stopped manually, etc. And it contains the unix timestamp in milliseconds of when the rule was started and when it was paused.
The other part is the metrics for each operator of the rule. The operator of the rule is generated based on the SQL of the rule, which may be different for each rule. In this example, the rule SQL is the simplest SELECT * FROM demo, the action is MQTT, and the generated operators are [source_demo, op_project, sink_mqtt]. Each of these operators has the same kind of metrics, which together with the operator names form a single metric. For example, the metric for the number of records_in_total for the operator source_demo_0 is source_demo_0_records_in_total.
Metric Types
The metrics are the same for each operator and are mainly the following:
- records_in_total: the total number of messages read in, indicating how many messages have been processed since the rule was started.
- records_out_total: total number of messages output, indicating the number of messages processed by the operator correctly.
- process_latency_us: latency of the most recent processing in microseconds. The value is instantaneous and gives an idea of the processing performance of the operator. The latency of the overall rule is generally determined by the operator with the largest latency.
- buffer_length: the length of the buffer. Since there is a difference in computation speed between operators, there is a buffer queue between each operator. A larger buffer length means the processing is slower and cannot catch up with the upstream processing speed.
- last_invocation: the time of the last run of the operator.
- exceptions_total: the total number of exceptions. Reconverable errors generated during the operation of the operator, such as broken connections, data format errors, etc., are counted as exceptions without stopping the rule.
After version 1.6.1, we added two more exception-related metrics to facilitate the debugging of exceptions.
- last_exception: the error message of the last exception.
- last_exception_time: the time of the last exception.
After version 2.0.0, we added connection-related metrics for source/sink.
- connection_status: Connection status. 1 for connected, 0 for connecting, -1 for disconnected.
- connection_last_connected_time: The last successful connection time.
- connection_last_disconnected_time: The last disconnection time.
- connection_last_disconnected_message: The message of the last disconnection exception.
- connection_last_try_time: The last reconnection attempt time.
The numeric types of these metrics can all be monitored using Prometheus. In the next section we will describe how to configure the Prometheus service in eKuiper.
View CPU running metrics for a rule
- kuiper_rule_cpu_ms: The CPU running indicator of the rule represents the CPU time used by the CPU in the past 30 seconds, in ms.
Configuring the Prometheus Service in eKuiper
The Prometheus service comes with eKuiper, but is disabled by default. You can turn on the service by modifying the configuration in etc/kuiper.yaml. Where prometheus is a boolean value, change it to true to turn on the service; prometheusPort configures the port of the service.
  prometheus: true
  prometheusPort: 20499
If you start eKuiper with Docker, you can also enable the service by configuring environment variables.
docker run -p 9081:9081 -d --name ekuiper MQTT_SOURCE__DEFAULT__SERVER="$MQTT_BROKER_ADDRESS" KUIPER__BASIC__PROMETHEUS=true lfedge/ekuiper :$tagIn the log of the startup, you can see information about the service startup, for example:
time="2022-08-22 17:16:50" level=info msg="Serving prometheus metrics on port http://localhost:20499/metrics" file="server/prome_init.go:60 "
Serving prometheus metrics on port http://localhost:20499/metrics
Click on the address http://localhost:20499/metrics in the prompt to see the raw metrics information for eKuiper collected in Prometheus. Users can search the page for metrics like kuiper_sink_records_in_total after the eKuiper has rules running properly. Users can configure Prometheus to connect to eKuiper later for a richer presentation.
Using Prometheus to monitor status
Above we have implemented the ability to export eKuiper status as Prometheus metrics, we can then configure Prometheus to access this part of the metrics and complete the monitoring.
Installation and Configuration
Go to the Prometheus website to download the version for your platform and then unzip it.
Modify the configuration file so that it monitors eKuiper. open prometheus.yml and modify the scrape_configs section as follows.
global:
scrape_interval: 15s
evaluation_interval: 15s

rule_files:
# - "first.rules"
# - "second.rules"

scrape_configs:
- job_name: ekuiper
  static_configs:
    - targets: ['localhost:20499']
This defines a monitoring job named eKuiper, targets pointing to the address of the service started in the previous section. After the configuration is done, start Prometheus.
. /prometheus --config.file=prometheus.ymlAfter successful startup, open http://localhost:9090/ to access the management console.
Simple monitoring
Monitor the number of messages received by the sink for all rules. You can enter the name of the metric to be monitored in the search box as shown in the figure, and click Execute to generate the monitoring table. Select Graph to switch to line graphs and other display methods.
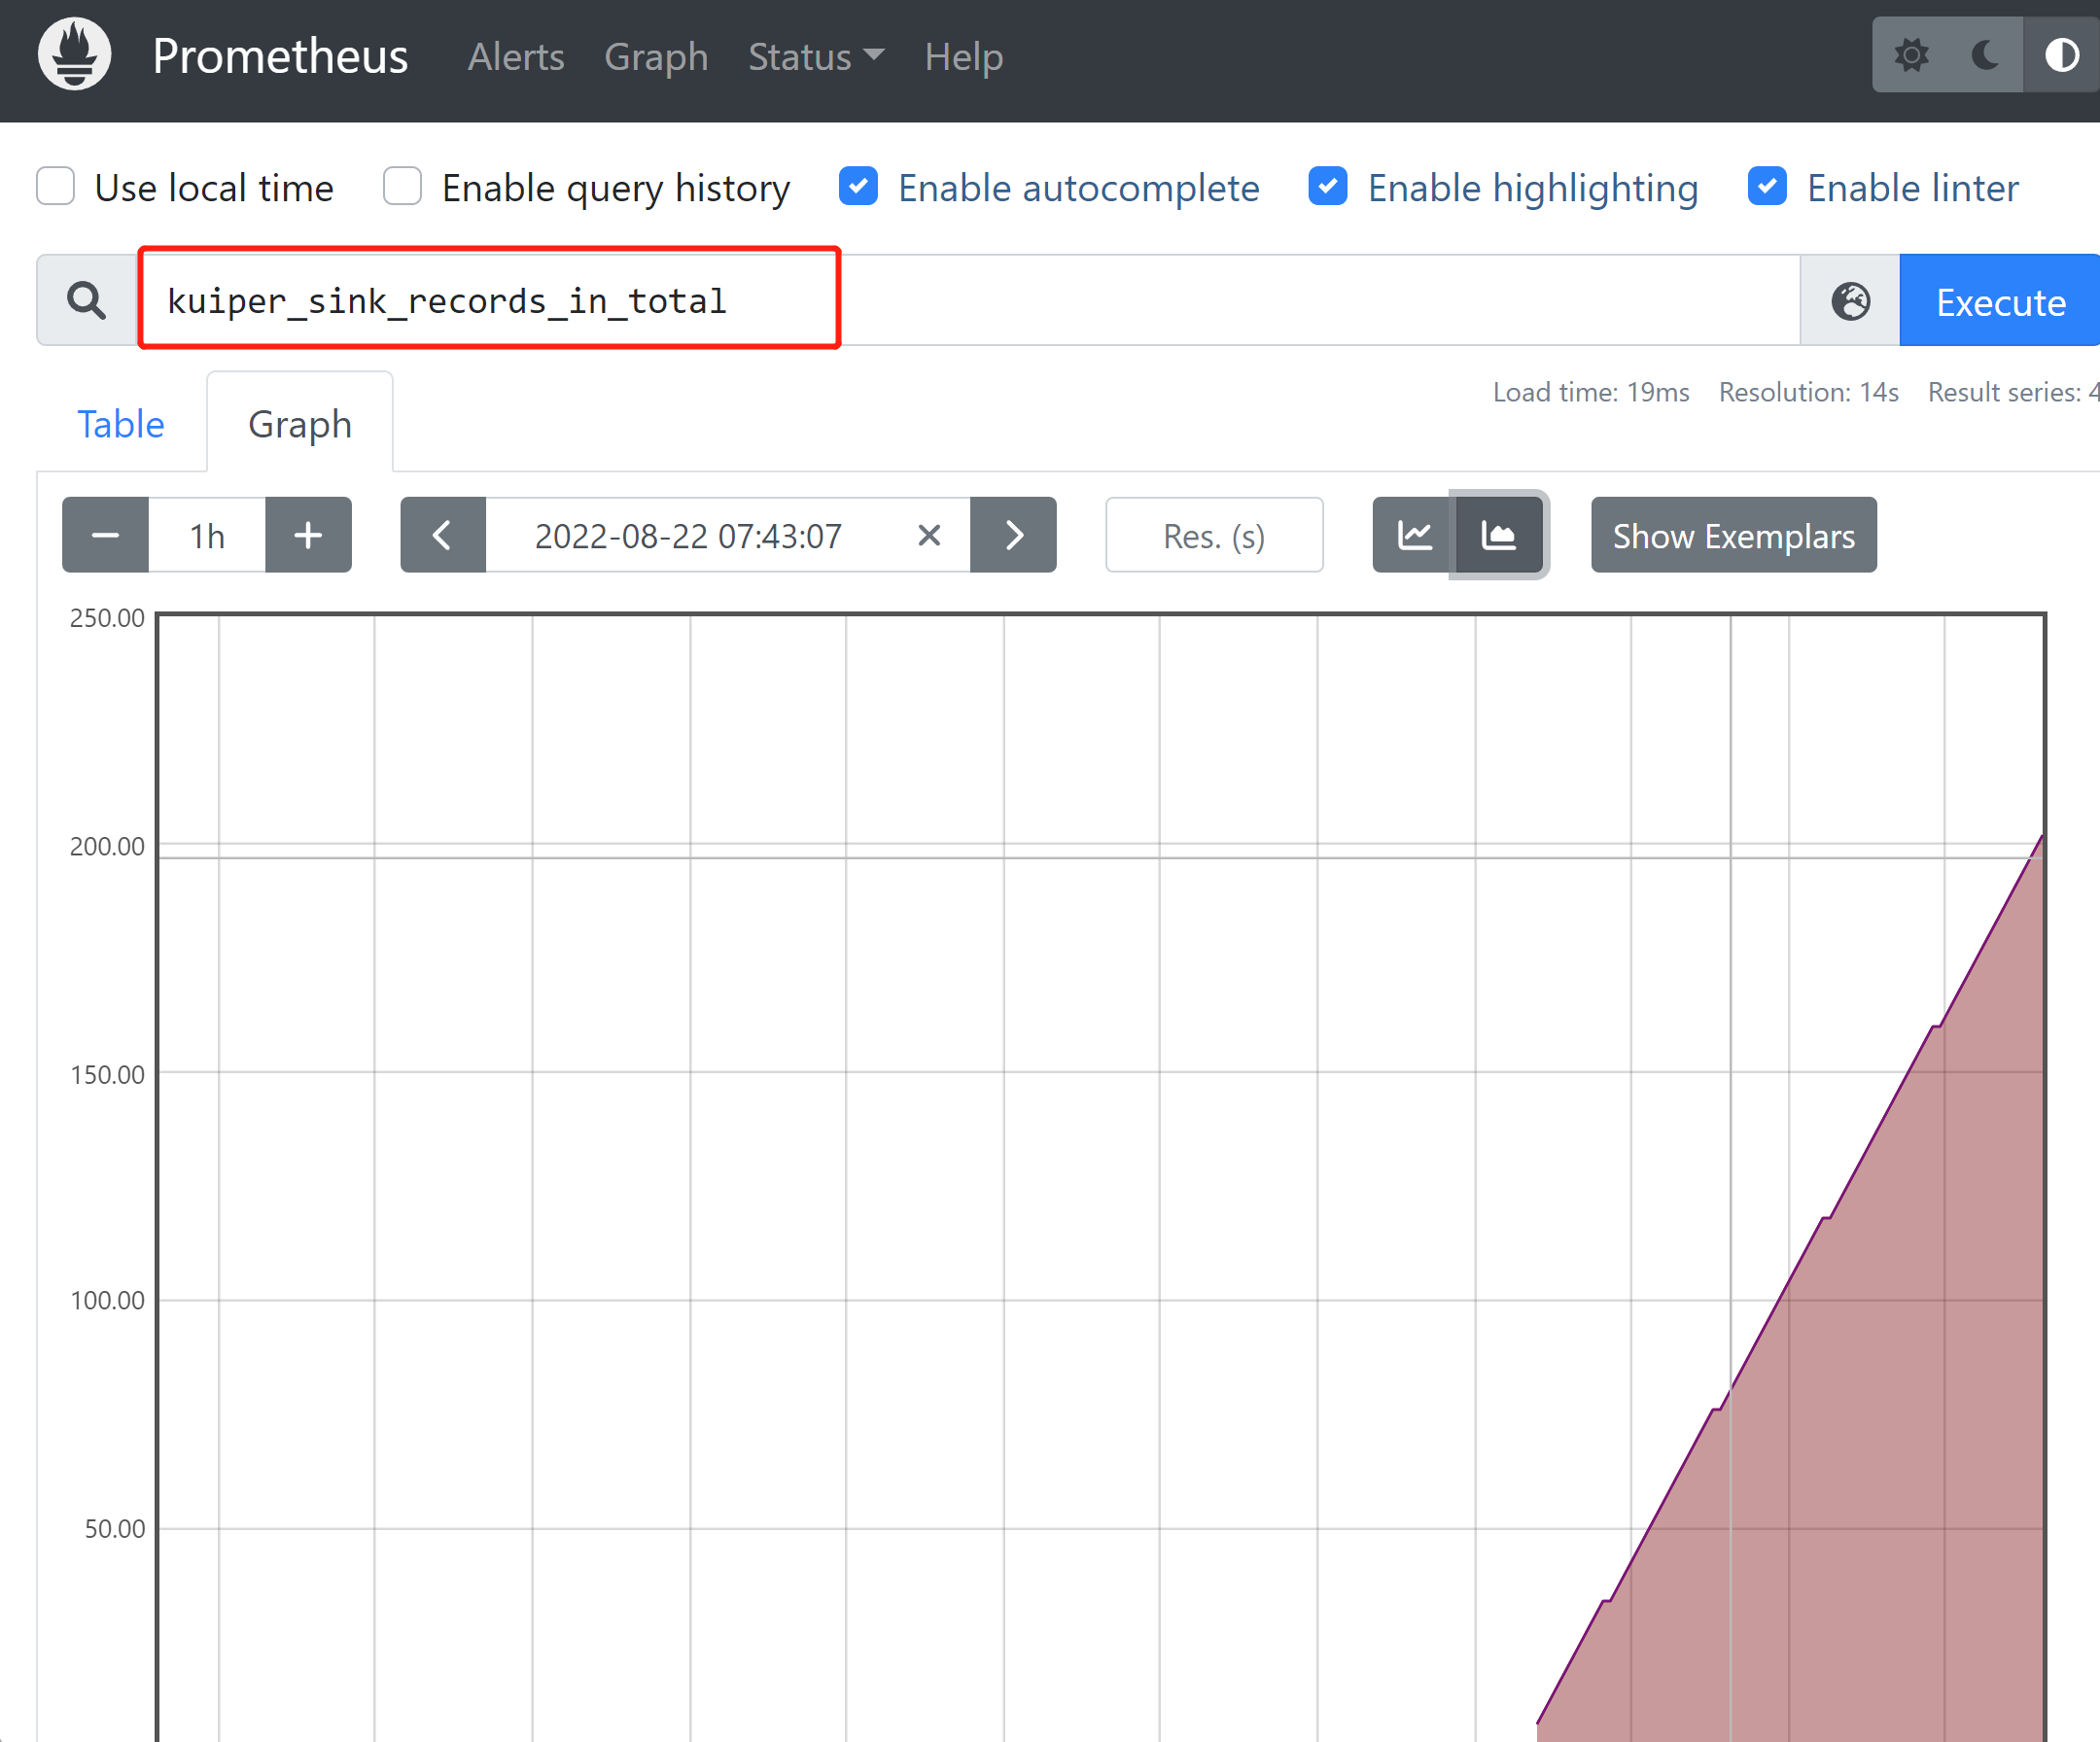
Click Add Panel to monitor more metrics in the same way.
View the dashboard via Grafana
Grafana is a monitoring instrument system. It is a system monitoring tool open sourced by Grafana Labs. It can greatly help us simplify the complexity of monitoring. We only need to provide the data that needs to be monitored, and it can help generate various visual instruments. .
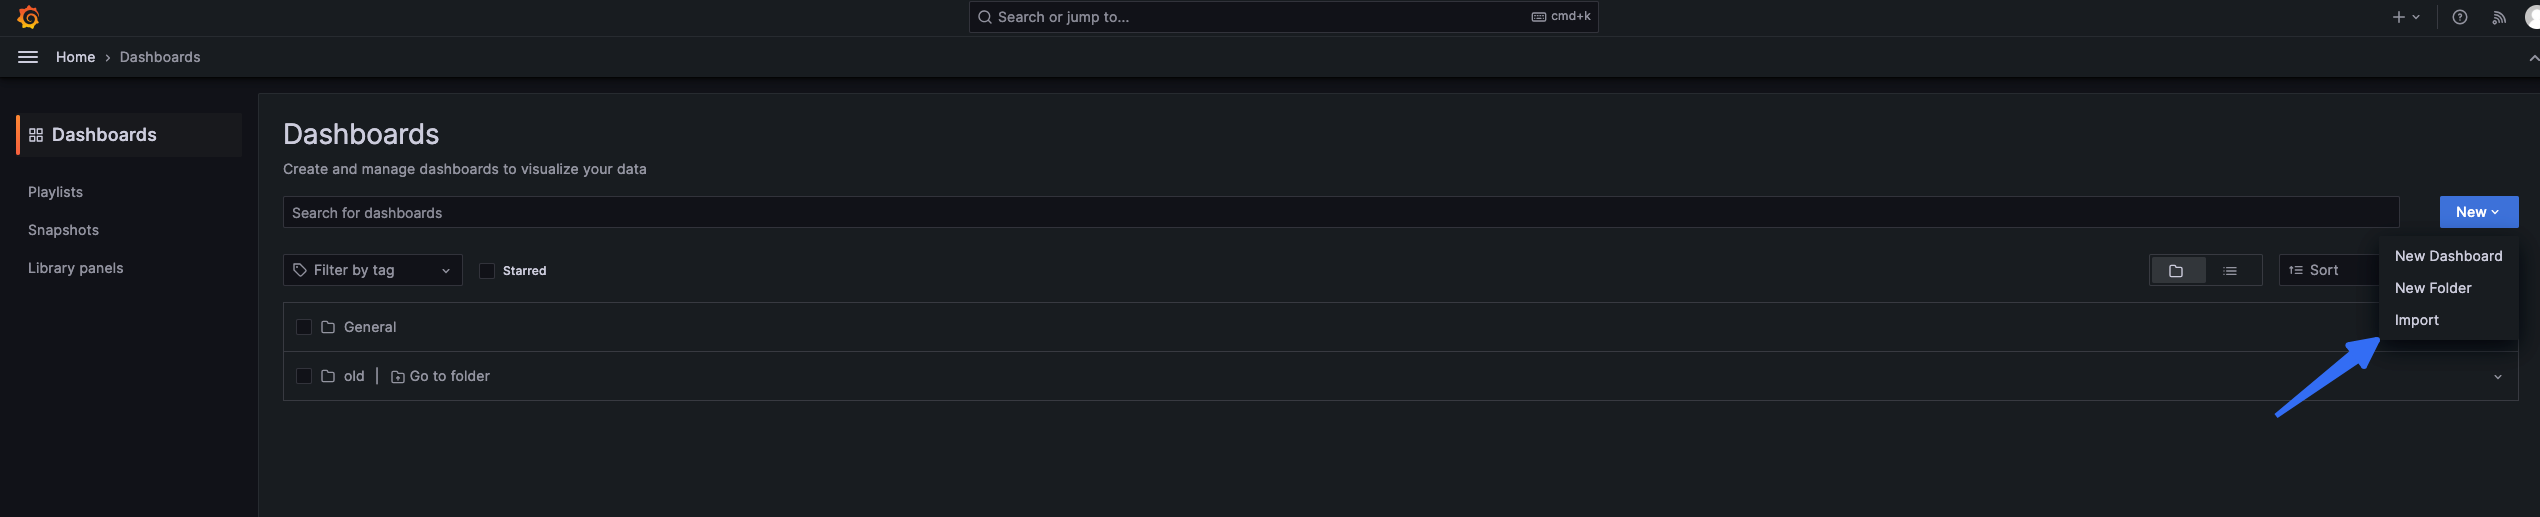
eKuiper is predefined in the Grafana panel to help users more clearly and intuitively observe the current running status of eKuiper from Prometheus monitoring data. You can use the Grafama Dashboard Import function to copy the json content in the following link into grafana to obtain the panel.
https://github.com/lf-edge/ekuiper/blob/master/metrics/metrics.jsonInstall eKuiper Dashboard
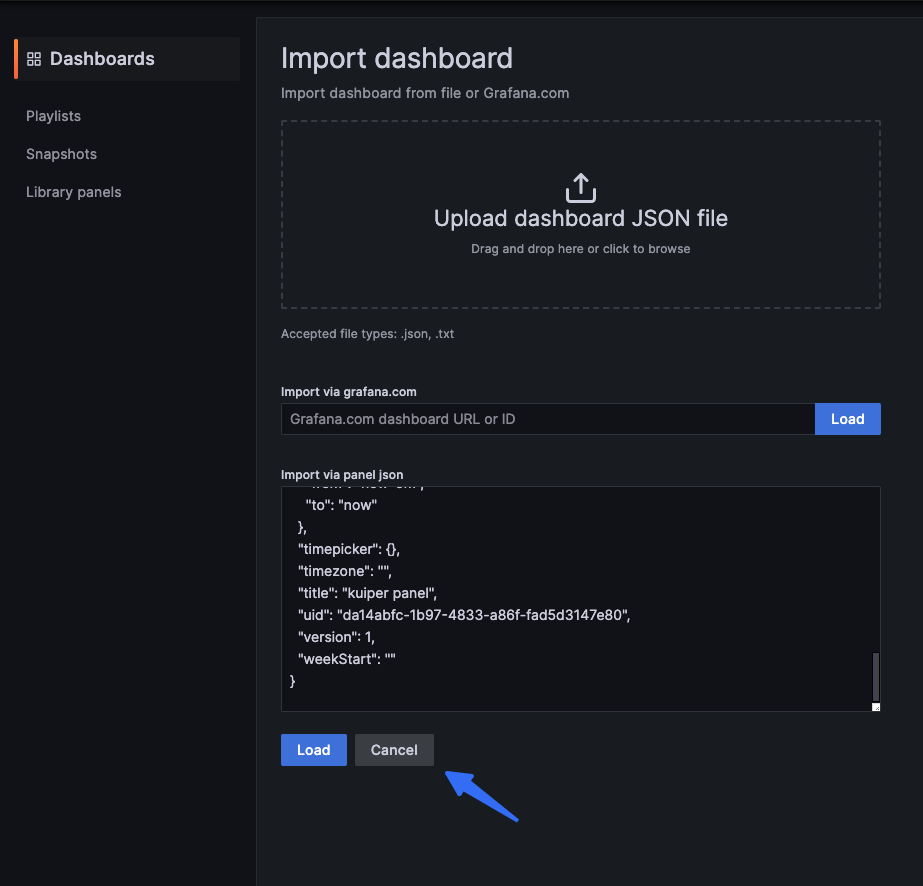
Before introducing the eKuiper monitoring panel to grafana, you need to ensure that grafana has configured prometheus as a data source, and that prometheus has collected eKuiper monitoring data.
Copy metrics json into the text box and click Load.
Set the Dashboard name and set the corresponding prometheus data source.
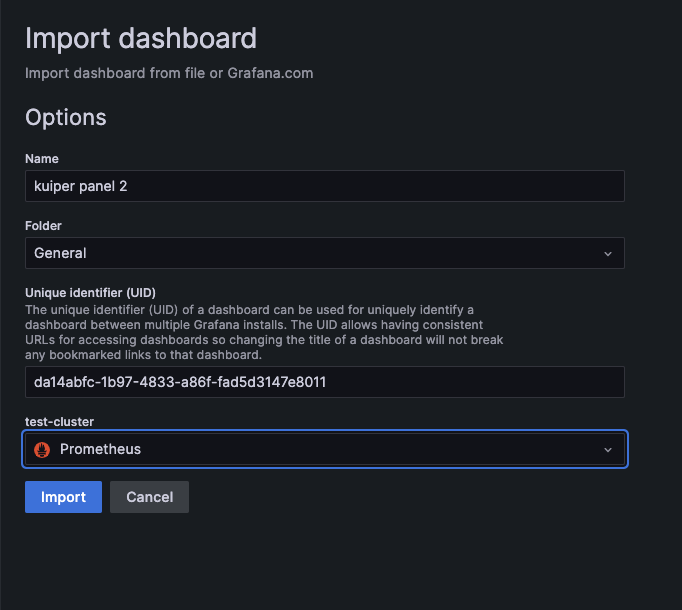
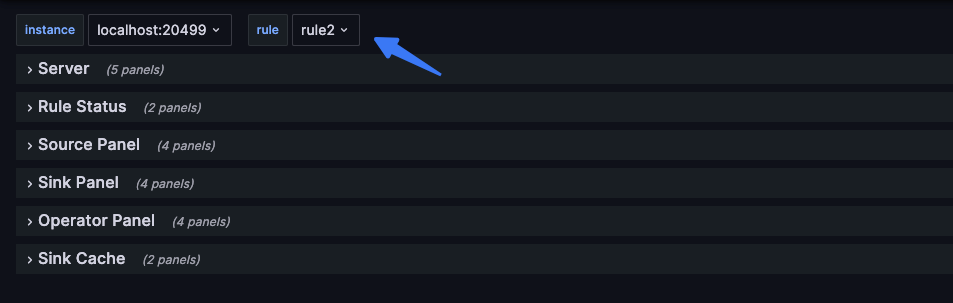
After we introduce the panel, we can view the corresponding eKuiper instance and the metrics associated with the corresponding rules in the instance in the selection bar on the page.
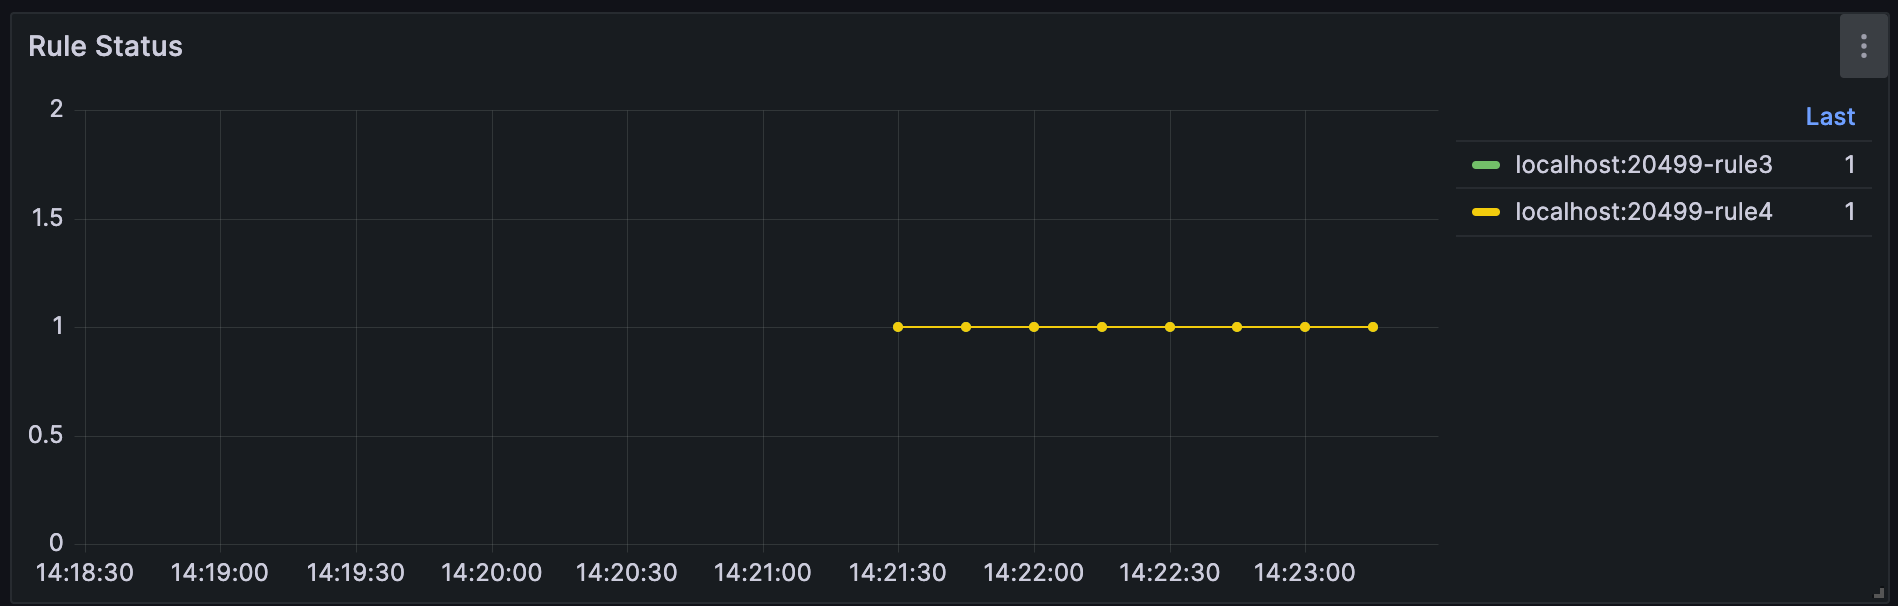
You can view the historical status of the rule through the following panel. 1 means the rule is running, 0 means the rule is suspended normally, and -1 means the rule exited abnormally. The metric is kuiper_rule_status.
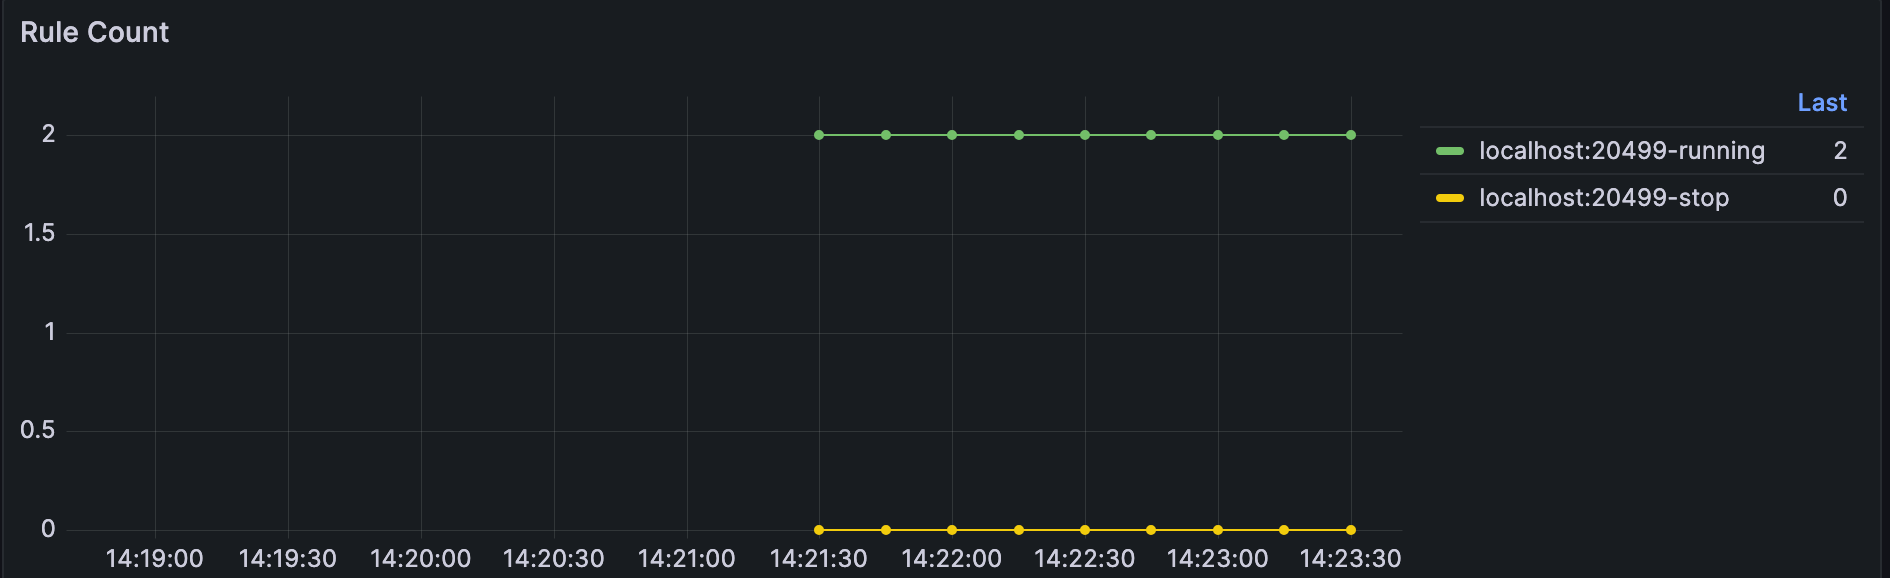
You can view how many running rules and paused rules there are inside eKuiper through the following panel. The metric is kuiper_rule_count.
Summary
This article introduced the rule metrics in eKuiper and how to use Prometheus to monitor these metrics. Users can further explore more advanced features of Prometheus based on this to improve eKuiper's operation and maintenance.